
The Big Bleach
Quantifying a Coral Catastrophe in the Maldives

Schooling bannerfish (Heniochus diphreutes) swimming past dead table corals
2016 was a rough year for the world’s coral reefs. Higher than normal ocean temperatures caused coral bleaching all around the planet, from East Africa across the Indian Ocean and throughout Indonesia, among Pacific islands like Hawaii and Kiribati, in Florida and the Caribbean, from Japan and the Philippines to the South China Sea, with an especially dramatic hit to Australia’s Great Barrier Reef. Bleaching events of this scale have happened only a few times in recorded history and are becoming more frequent as oceans warm. Such catastrophic occurrences threaten the survival of remarkable coral ecosystems as well as hundreds of millions of people who rely on these habitats for food and jobs.

A dead table coral after the recent mass bleaching
The recent Hydrous expedition to the Maldives began in late November, about eight months after the worst of this bleaching, so we had a chance to view the aftermath. We had heard reports that ~60% of Maldivian reefs were bleached but, keeping in mind that a bleached reef is not a dead reef and knowing that corals can recover from events like this, we hoped for the best. We did not expect to see much bleaching, if any, because water temperatures had cooled by the time we arrived. Rather, we were interested in assessing post-bleaching mortality and looking for signs of recovery.
Before we unpacked our dive slates, underwater paper, and sampling quadrats, we glimpsed the damage. On our first checkout dive, we saw the skeletons of enormous table-top Acropora colonies that were gray as stone, overturned, swamped by sediment, or overgrown with green algae. It was like viewing the ruins of a once great city. Living corals are colorful; a healthy reef glows with golden browns, blues, and pinks, whereas this reef was dominated by muted grays and greens.

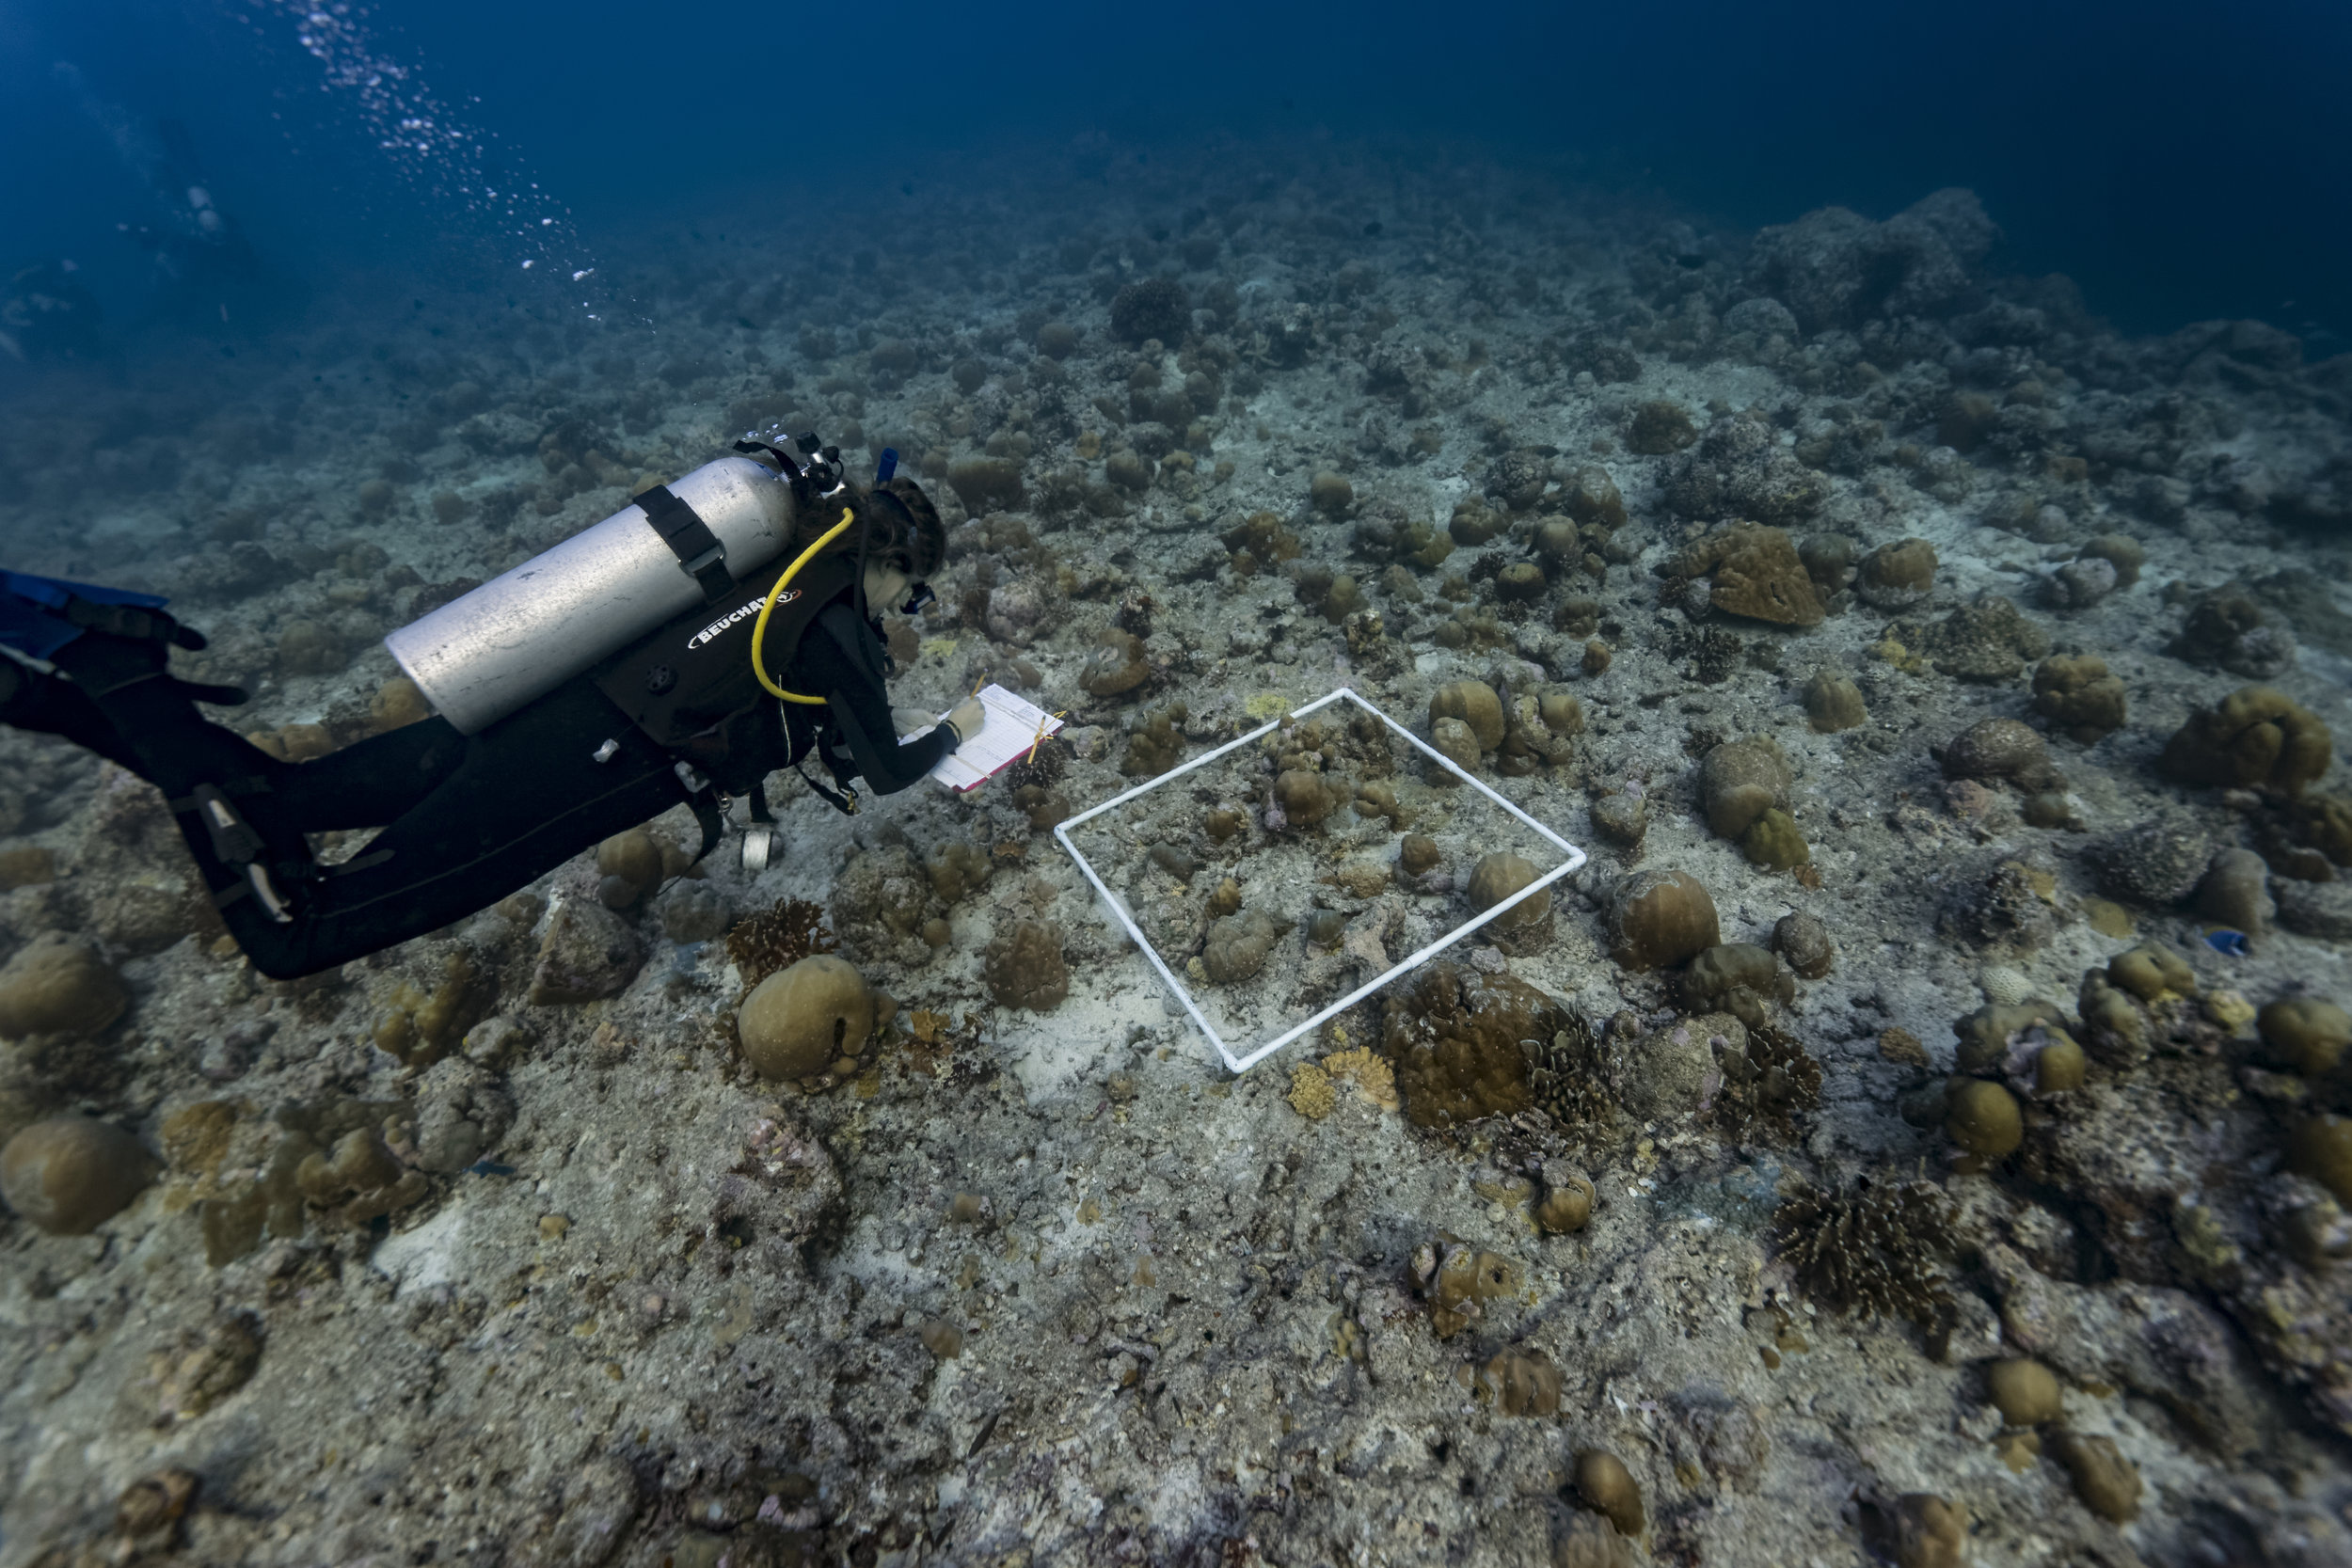
Still hopeful, we knew that systematic, quantitative data is far superior to personal impressions. We can’t draw conclusions from one dive and a lazy color assessment. Reef monitoring is a central component to Hydrous expeditions and most people on board learned a standardized rapid protocol to assess coral bleaching. This method was developed by Wildlife Conservation Society (WCS) scientist Dr. Tim McClanahan and has been used around the world to monitor bleaching events since 1998, including over 250 sites in 13 countries during the 2016 El Niño. Citing the importance of long-term monitoring and “many eyes on the reef,” WCS scientists developed these methods to also be accessible to local community members, divers, and snorkelers who may not have ecology backgrounds. The Hydrous expedition taught these methods to our unique team of designers, engineers, tech professionals, and Maldivian environmental stewards to monitor the frequency and severity of bleaching on the reefs that we were visiting.

Dr. Woolsey using a quadrat, a clipboard, underwater paper, and a pencil to survey the reef with the WCS protocol
The Hydrous team conducted surveys at five sites in the central Maldives: Bandos, Bodufolhudhoo, Rasdhoo, Reethi Beach, and Villingilli (Fig. 1). Three of these sites (Bandos, Reethi Beach, and Villingilli) were monitored with the same protocol during the height of the bleaching in April/May 2016 by a scientist from the International Union for the Conservation of Nature (IUCN). This scientist observed substantial bleaching at these sites: 24% of all coral colonies were bleached at Bandos, 78% at Reethi Beach, and 64% at Villingilli (Fig 2). Surveys were conducted at 2 meters depth at Reethi Beach and 10 meters at both Bandos and Villingilli. [Note: Bandos was monitored at the onset of bleaching in April. When the IUCN scientist viewed this reef at the height of the bleaching, closer to 85% of the reef was bleached.]
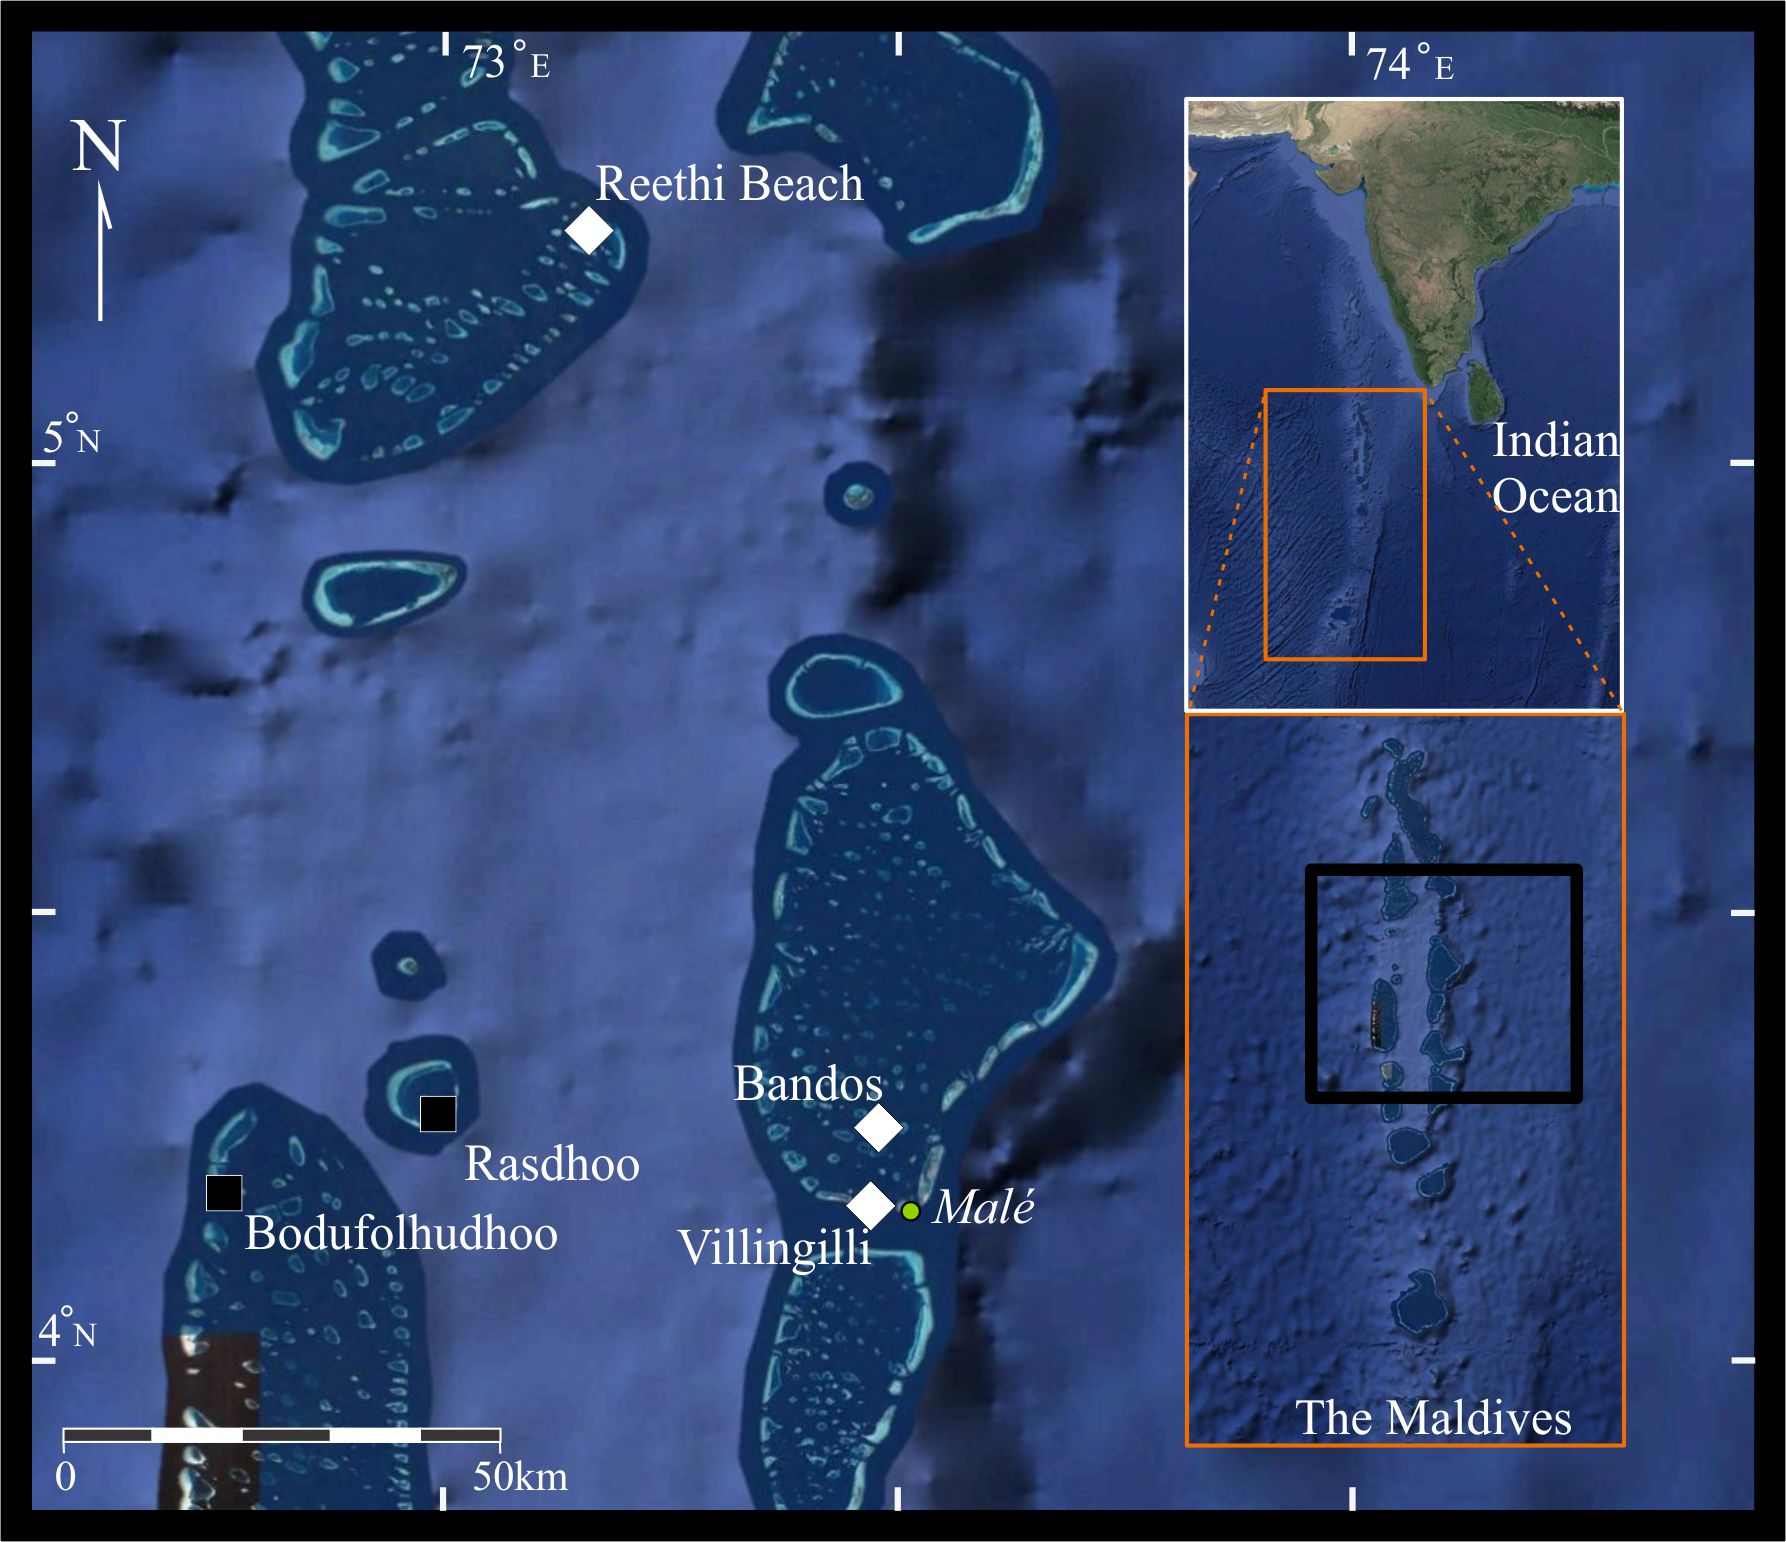
Figure 1: Map of the central Maldives, showing 5 sites surveyed by the Hydrous in December 2016. Sites that were also surveyed in April/May 2016 using the WCS protocol are shown with white diamonds. Sites surveyed only in December 2016 are represented by black squares (these data will be used for future comparisons).

Figure 2. Percentage of bleached colonies observed during the mass bleaching event in April/May of 2016. Percentages were calculated by dividing the total number of bleached coral colonies by total number of colonies. Note: error bars are absent in this figure because the protocol uses a running tally of colonies rather than counts per quadrat.
Using the April/May survey data that the IUCN scientist generously shared with Hydrous, we could compare the state of the same three sites (shown in white diamonds in Fig.1) during and after the bleaching. By the time we arrived in the Maldives in late November, water temperatures had dropped to pre-bleaching levels. We recorded 28-29ºC at each site compared to 30-31ºC measured in April/May 2016 (it’s amazing how a sustained rise of only 1-2ºC degrees can inflict such widespread damage). Though we didn’t observe bleaching, we could still use the WCS protocol to understand the impacts of bleaching by measuring indicators for reef health including live cover of hard, reef-building corals, presence of macroalgae (i.e. seaweed, which competes for space with coral), colony density, and coral mortality.
We found that the reefs had changed considerably after the bleaching (Figs 3-7). Hard coral cover dropped after the bleaching in both Bandos (from 25 ± 3% to 13 ± 2%) and Reethi Beach (from 26 ± 5% to 17 ± 3%), whereas it remained low in Villingilli (~10%; Fig 3). Macroalgae cover increased at both Bandos and Reethi Beach, but remained under 10% (Fig 4). Unfortunately, such reductions in live coral cover and increases in macroalgae cover are signs of a degrading reef. At Villingilli, macroalgae cover was high both during and after the bleaching (19 ± 4% and 18 ± 3%, respectively; Fig 4).

Figure 3: Mean percentage hard coral cover at each site during (light blue) and after (dark blue) the 2016 bleaching event. Error bars show standard error. Means were calculated by estimating the percentage of hard corals (i.e. reef building corals or scleractinians) in each square meter quadrat then dividing the sum by the number of total quadrats.

Figure 4: Mean percentage macroalgae cover at each site during (light blue) and after (dark blue) the 2016 bleaching event. Error bars show standard error. Means were calculated by estimating the percentage of macroalgae (seaweed) in each square meter quadrat then dividing the sum by the number of total quadrats.
Colony density dropped at all locations following the bleaching (Fig 5) and post-bleaching mortality increased substantially (Fig 6). In April/May, the percentage of recently dead coral colonies was 0% at Bandos, 2% at Reethi Beach, and 8% at Villingilli. By the time Hydrous visited these reefs, coral mortality was 13% at Bandos, 19% at Reethi Beach, and 26% at Villingilli (Fig 6).

Figure 5: Colony density, measured in number of coral colonies per square meter, at each site before (light blue) and after (dark blue) the 2016 bleaching event. Note: error bars are absent in this figure because the protocol uses a running tally of colonies rather than counts per quadrat.
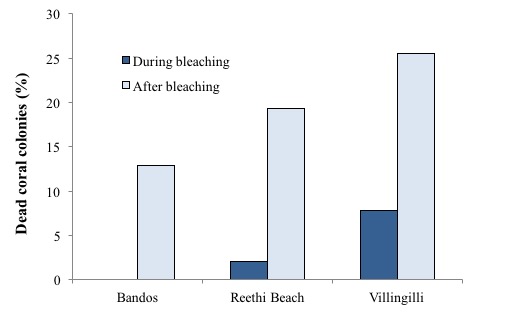
Figure 6: Percentage of dead coral colonies at each site before (light blue) and after (dark blue) the 2016 bleaching event. Note: error bars are absent in this figure because the protocol uses a running tally of colonies rather than counts per quadrat.
Because we identified each coral colony to the genus level, we could also track specific types of corals, especially those that are highly susceptible to bleaching, such as Acropora (Fig 7). Our data showed that percentage of Acropora colonies dropped from 40% to 6% at Bandos and 10% to 1% at Reethi Beach. This genus had low representation at Villingilli both during and after the bleaching (1% and 2% respectively).

Figure 7: Percentage of Acropora sp. colonies observed at each site during and after the 2016 bleaching event. Percentages were calculated by dividing the total number of Acropora colonies by total number of colonies. Note: error bars are absent in this figure because the protocol uses a running tally of colonies rather than counts per quadrat.
So, what’s going on at Villingilli? This site had low hard coral cover, high macroalgal cover, and few Acropora colonies (all indicators of an unhealthy reef) after the bleaching and during it. This suggests that Villingilli was heavily impacted even before the bleaching happened. Unfortunately we don’t have data to report prior to the bleaching to tell the full story, but perhaps the state of the reef at Villingilli has something to do with its location. Villingilli is next to an urban area, close to the Maldivian capital Malé. This place experiences high boat traffic, does not have fishing restrictions, and neighbors an artificial island nicknamed ‘trash island,’ a municipal landfill and the site of continuous rubbish burning. The combined factors of such pollution and fishing pressures are likely to contribute to the long-term degradation of the local reef.

Malé, the Maldivian capital, is one of the most densely populated cities in the world. Our Villingilli survey site is nearby.
In contrast to Villingilli, Bandos and Reethi Beach are both considered “no-take” areas and are located near resorts, which may account for these reefs’ higher coral cover, lower macroalgae cover, and lower post-bleaching mortality. Restricted fishing as well as stewardship by resort staff may contribute to the relative health of these reefs prior to bleaching, which lessens the susceptibility to bleaching. For example, more fish on a reef means more grazing and removal of macroalgae, allowing the recruitment of new corals to rehabilitate their populations. Indeed, we know that management and local engagement matter, so these factors may also allow these reefs to recover from the catastrophic event.
We found that the effects of bleaching varied among locations. Local management practices, pre-bleaching health, and the level of sustained heat stress and water movement on each reef during the 2016 El Niño likely influenced such variation. At all sites, colony density decreased and instance of dead colonies increased following the bleaching, and at Reethi Beach and Bandos, the bleaching predictably led to reduction of hard coral cover, increase in macroalgae cover, and a sharp drop in representation of Acropora colonies. The reef at Villingilli meanwhile, did not show substantial changes between April/May and December; hard coral cover was already low, macroalgal cover high, and instance of acroporids negligible.

This photo was taken during the previous Hydrous expedition to the Maldives in 2015, when Acropora colonies were ubiquitous.
So what’s next for these reefs? Can they bounce back or will they continue to degrade and die? We certainly expect the types of changes we’ve seen in other disturbed reefs, such as the departure of Acropora and other susceptible corals, as well as a reduction in reef complexity, which alters dynamics throughout the ecosystem. In our warming and acidifying oceans, corals and other tropical organisms are faced with three options: adapt, move, or die. Which option will be realized depends on a number of factors including amplitude of change in a given habitat, the adaptive capacity and phenotypic plasticity of a particular species or population, as well as migration and dispersal ability.
The human response is also imperative to determining survival of coral reefs. On our side, reducing greenhouse gas emissions and lessening the effects of climate change would significantly strengthen the future of coral reefs. Regrettably, places like the Maldives, which are among the lowest emitters of greenhouse gases in the world, are getting hit the hardest by climate change, so leadership from developed nations is vital. Sea level rise and coral bleaching jeopardizes tourism and fishing, two critical industries for the Maldivian economy, as well as the very existence of this island nation. Much of the land in the Maldives is below an elevation of one meter, and so rising sea levels threaten to flood this country. Increasing erosion exacerbates the effects of rising sea levels, especially with ongoing degradation of the coral reefs that act as natural breakwaters.
In coordination with global efforts to reduce carbon emissions, locally managing more perceivable and controllable pressures- like pollution, overfishing, and development- is crucial to long-term survival of coral reefs in a changing climate. In fact, Marine Protected Areas (MPAs, which Sylvia Earle calls ‘hope spots’) are helping marine environments survive, but they can also be more strategically designed to withstand the global impacts of climate change. People around the world are working hard to monitor, manage, and prevent direct impacts and, as a result, we are seeing that ocean health and reef resilience can improve in the face of changing environments. Coral-reef ecosystems can withstand and even recover from disturbances if they are well managed and if they are in locations that can avoid or escape the worst exposure to climate change. Perhaps we are seeing the effects of the local management factor in the stark contrast between Villingilli, an open area near an urban center, and Bandos and Reethi Beach, two reefs that are designated “no-take” and are under some degree of protection (as this author can attest to, as our survey at Reethi Beach was cut short by resort security).
This exercise in coral monitoring conducted by the Hydrous highlights the importance of long-term systematic observations of coral reefs following bleaching events. All of the data collected in our surveys have been provided to the WCS global collaboration around the 2016 El Niño event and the IUCN scientist to contribute to their growing datasets of coral bleaching events and recovery. Anyone who is trained in the WCS protocol, by the Hydrous or elsewhere, can collect and report raw data for ongoing monitoring. The Hydrous intends to travel back to the Maldives in 2017 to document ongoing changes and elucidate how these reefs are responding so they can be better understood and protected. We hope to see signs of successful recovery on our next visit. In the meantime, we will strive to recruit others to embrace and uphold the human role in the evidenced solutions (e.g., reducing pollution, fishing pressures, and global emissions). Compassion and involvement on a greater scale is required to ensure recovery and survival for coral reefs in the Maldives and throughout our beautiful and changing ocean.
Learn More
The scientific community has produced a lot of great reports (like this one, this one, and this one) on coral reefs and the threats they face. If you have questions or specific interests, let me know! erika@thehydro.us
What can you do to help coral reefs and other ocean environments?
A lot! For example: Choose sustainable seafood, be energy efficient, conserve water, practice safe boating, dive responsibly, choose resorts and dive operators that respect and protect marine life, learn about coral reefs and teach others, cut down on waste- especially plastics, support marine protection and effective climate legislation, donate, volunteer, invent new technologies to understand and protect our oceans, and anything else you can think of!
Note:
The purpose of this blog entry is to present preliminary data on the effects of coral bleaching in the Maldives for a general audience. We present descriptive statistics and have not run robust statistical analyses on these data. Other limitations include: sample size (50 square meter quadrats at 3 sites), different observers among time points (IUCN scientist in April/May and Dr. Woolsey in December), absence of pre-bleaching data and long-term temperature records, and variation in replicates (we measured 10 quadrats instead of the target 20 at Reethi Beach).
Acknowledgements:
We thank Hassan Hameez and the Theia crew for logistical support, Dr. Emily Darling for her guidance and helpful comments, Rick Miskiv for photography, Nora Hall and Kate Malgram for enduring support and insights, and all 2016 Hydrous expedition participants for survey assistance and ongoing commitment to ocean health: Cecilia Dobner, Brandon Goh, Pedro Sousa, Mandy Man, Kiran Punnilathil, Steve McClellan, Aaron Roan, Laszlo Varga, Dominique Pouliquen, Nathalie Pouliquen, Frank Schwab, Kathryn Berry, and Craig Langbein. This Hydrous expedition was generously supported by The Autodesk Foundation, Lenovo, personal donations, and price matching by Google and Autodesk.